Global Nutritional Premixes Market Size and Overview
Nutritional Premixes Market Outlook
A nutritional premix is a customized blend where each nutrient component is presaled, which is used in infant food, food & beverages, animal feed, healthcare, and personal care applications for enrichment or fortification purposes with an objective of enhancing the nutritional value of the products. Demand for nutritional premixes has grown particularly fast in developing economies, as industrial growth has translated into greater urbanization, huge base of population, and higher per capita incomes. Also, the pace with which, global middle- class has grown, it has demanded larger quantities of higher quality and more diverse food. The global nutritional premixes market size was $8,658.2 million in 2018, and is projected to reach $11,647.6 million by 2025, growing at a CAGR of 4.5% from 2019 to 2025.
Nutritional Premixes Market Snapshot
global_nutritional_market.
Market Dynamics
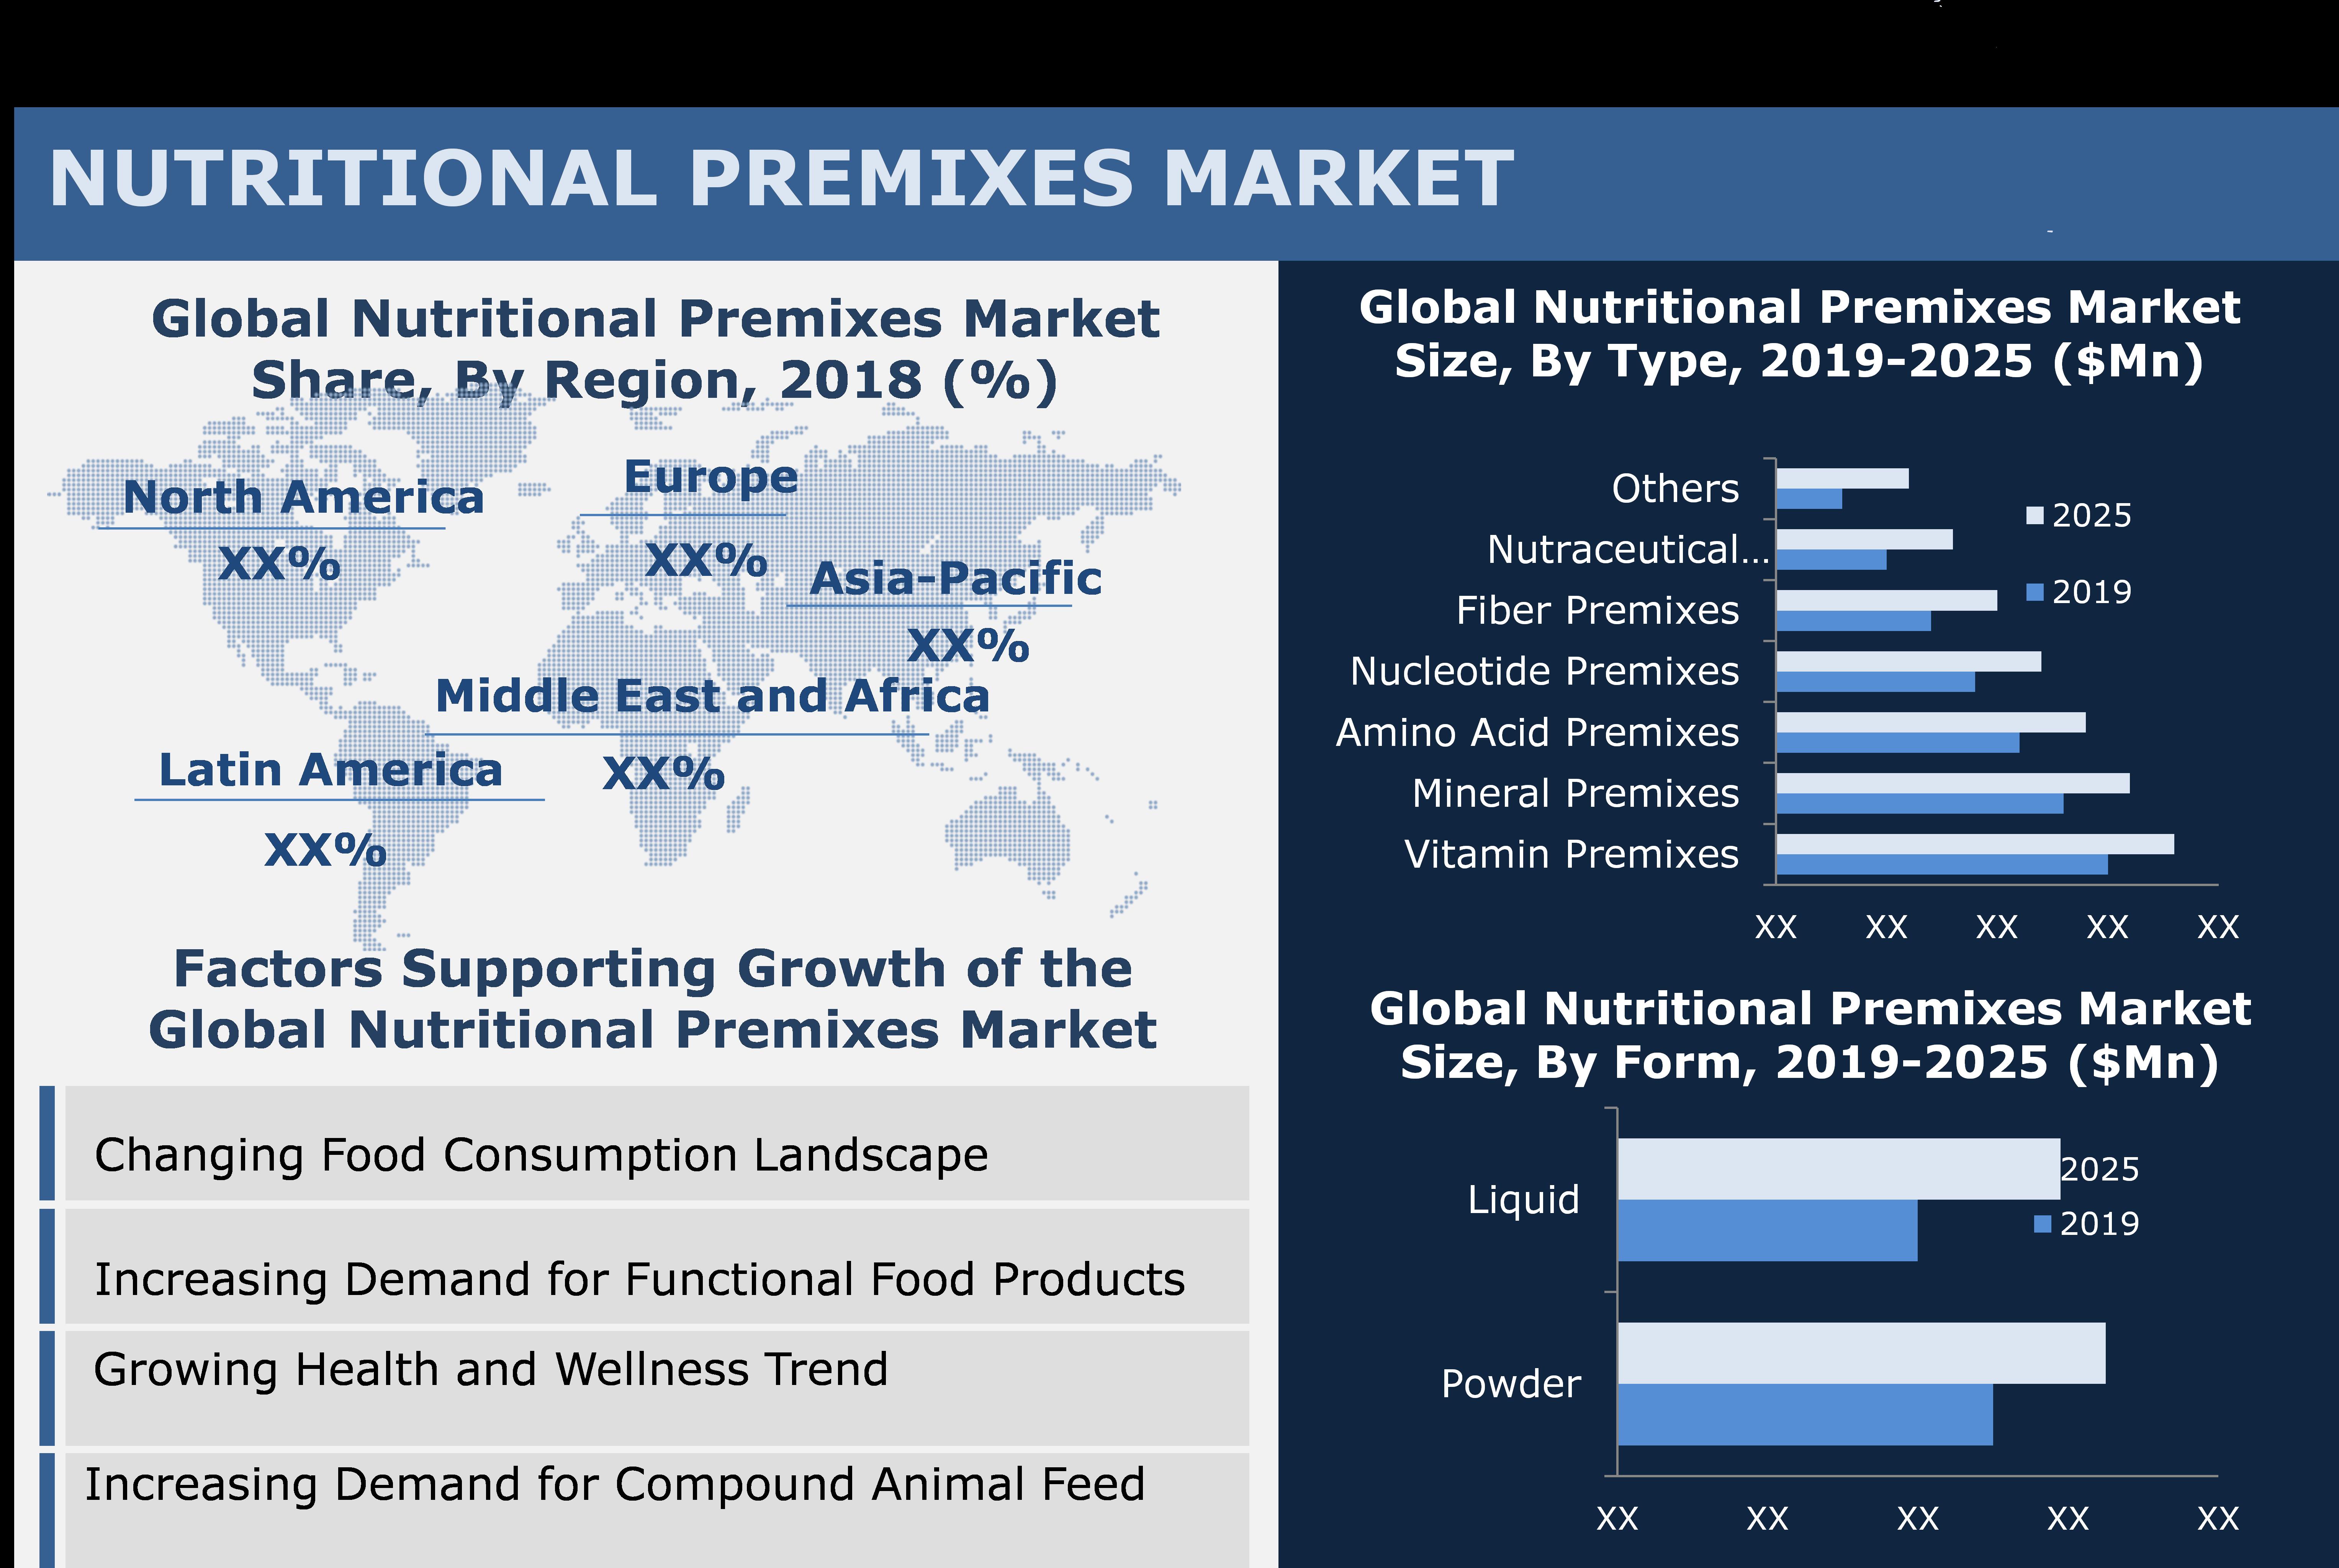
Changing food consumption landscape, increasing demand for functional food products, growing health and wellness trend, and increasing demand for compound animal feed have fueled the growth of the global Nutritional Premixes market. Conversely, stringent regulatory structure and technical problem during storage and handling of nutritional premixes has hindered the growth of this market to some extent.
Segment Overview:
Type Segment Overview
On the basis of type, vitamin premixes segment accounted for the major share of the global nutritional premixes market in 2018. The large share of this segment mainly attributed to the increasing consumer preferences for blends of different functional ingredients, multiple nutritional benefits to humans and animals, and growing consumption of vitamin supplements due to rising number of vitamin deficiency cases. However, nucleotide premixes market is expected to witness a rapid during the forecast period.
Drug Formulation Segment Overview
On the basis of application, animal feed segment held the largest share of the global nutritional premixes market in 2018. The large share of this segment mainly attributed to growing livestock industry due to increasing meat consumption, ban on antibiotics, and increasing importance for animal health safety and wellness.
Geographic Overview
On the basis of geography, the nutritional premixes market analysis is conducted across North America, Europe, Asia-Pacific, Latin America, and Middle East and Africa. Asia-Pacific held the major share in global nutritional premixes market in 2018, and is expected to remain dominant throughout the forecast period. The huge share of this market is attributed to its increased demand for compound animal feed; increasing investment from leading players; increasing demand for healthy & nutritional products; increasing consumer expectations for innovation and healthy food products; and rising alertness among consumers for fortified food products.
Competitive Landscape
The global nutritional premixes market is a moderately competitive market. To enlargement of market presence key ma players’ mainly focus on strategies such as new product launches, mergers, acquisitions, and collaborations. Key players include in Nutritional Premixes market are Koninklijke DSM N.V., Steggall Nutrition, Glanbia Plc, BASF SE, Corbion N.V., Watson Foods Co., Inc., Archer Daniels Midland Company, Cargill, Incorporated, SternVitamin GmbH & Co. KG, Vitablend Nederland B.V., Hellay Australia Pty. Ltd., Nutreco N.V., InVivo Agrosciences, Farbest-Tallman Foods Corporation, and Jubilant Life Sciences Ltd..
Nutritional Premixes Market Segments:
Nutritional Premixes Market by Type
Vitamin Premixes
Mineral Premixes
Amino Acid Premixes
Nucleotide Premixes
Fiber Premixes
Nutraceutical Premixes
Others
Nutritional Premixes Market by Form
Powder
Liquid
Nutritional Premixes Market by Application
Animal Feed
Food and Beverages
Nutrition and Health Supplements
Pharmaceuticals
Others
Nutritional Premixes Market by Geography
North America
U.S.
Canada
Europe
Germany
France
U.K.
Italy
Spain
Rest of Europe
Asia-Pacific
China
Japan
India
Rest of Asia Pacific
Latin America
Middle East & Africa
TABLE OF CONTENT
1. Introduction
1.1. Market Definition
1.2. Purpose of the Report
1.3. Currency
1.4. Limitations
1.5. Stakeholders
2. Research Methodology
2.1. Research Scope
2.2. Market Segmentation
2.3. Research Approach
2.3.1. Top-Down Approach
2.3.2. Bottom-Up Approach
2.4. Primary Research
2.5. Secondary Research
2.6. Assumptions
3. Executive Summary
3.1. Global Nutritional Premixes Market Snapshot, by Geography
3.2. Nutritional Premixes Market, by Type
3.3. Nutritional Premixes Market, by Form
3.4. Nutritional Premixes Market, by Application
3.5. Competitive Landscape
4. Market Overview
4.1. Market Dynamics
4.1.1. Driving Forces
4.1.1.1. Changing Food Consumption Landscape
4.1.1.2. Increasing Demand for Functional Food Products
4.1.1.3. Growing Health and Wellness Trend
4.1.1.4. Increasing Demand for Compound Animal Feed
4.1.2. Restraining Factors
4.1.2.1. Stringent Regulatory Structure
4.1.2.2. Technical Problem During Storage and Handling of Nutritional Premixes
4.1.3. Opportunity Matrix
4.1.3.1. Increasing Demand for Nutrition from Emerging Economies
5. Industry Insights
5.1. Porter's Five Forces Analysis
5.1.1. Bargaining power of supplier
5.1.2. Bargaining power of buyer
5.1.3. Threat of substitute
5.1.4. Threat of new entrant
5.1.5. Degree of competition
5.2. Value Chain Analysis
5.3. Pricing Analysis
5.4. Market Share Analysis
6. Nutritional Premixes Market, by Type
6.1. Vitamin Premixes
6.2. Mineral Premixes
6.3. Amino Acid Premixes
6.4. Nucleotide Premixes
6.5. Fiber Premixes
6.6. Nutraceutical Premixes
6.7. Others
7. Nutritional Premixes Market, by Form
7.1. Powder
7.2. Liquid
8. Nutritional Premixes Market, by Application
8.1. Animal Feed
8.2. Food and Beverages
8.3. Nutrition and Health Supplements
8.4. Pharmaceuticals
8.5. Others
9. Nutritional Premixes Market, by Region
9.1. North America
9.1.1. U.S.
9.1.2. Canada
9.2. Europe
9.2.1. Germany
9.2.2. France
9.2.3. UK
9.2.4. Italy
9.2.5. Spain
9.2.6. Rest of Europe
9.3. Asia-Pacific
9.3.1. China
9.3.2. Japan
9.3.3. India
9.3.4. Rest of APAC
9.4. Latin America
9.5. Middle East and Africa
10. Competitive Landscape
10.1. Key Players Analysis
10.2. Strategic Analysis
10.2.1. New Product Developments
10.2.2. Mergers & Acquisitions
10.2.3. Portfolio/Production Capacity Expansions
10.2.4. Geographic Expansions
10.2.5. Joint Ventures, Collaborations, Partnerships & Agreements
10.2.6. Others
11. Company Profiles
11.1. Koninklijke DSM N.V.
11.1.1. Company Overview
11.1.2. Financial Snapshot
11.1.3. Products
11.1.4. Recent Developments
11.2. Steggall Nutrition
11.2.1. Company Overview
11.2.2. Financial Snapshot
11.2.3. Products
11.2.4. Recent Developments
11.3. Glanbia Plc
11.3.1. Company Overview
11.3.2. Financial Snapshot
11.3.3. Products
11.3.4. Recent Developments
11.4. BASF SE
11.4.1. Company Overview
11.4.2. Financial Snapshot
11.4.3. Products
11.4.4. Recent Developments
11.5. Corbion N.V.
11.5.1. Company Overview
11.5.2. Financial Snapshot
11.5.3. Products
11.5.4. Recent Developments
11.6. Watson Foods Co., Inc.
11.6.1. Company Overview
11.6.2. Financial Snapshot
11.6.3. Products
11.6.4. Recent Developments
11.7. Archer Daniels Midland Company
11.7.1. Company Overview
11.7.2. Financial Snapshot
11.7.3. Products
11.7.4. Recent Developments
11.8. Cargill, Incorporated
11.8.1. Company Overview
11.8.2. Financial Snapshot
11.8.3. Products
11.8.4. Recent Developments
11.9. SternVitamin GmbH & Co. KG
11.9.1. Company Overview
11.9.2. Financial Snapshot
11.9.3. Products
11.9.4. Recent Developments
11.10. Vitablend Nederland B.V.
11.10.1. Company Overview
11.10.2. Financial Snapshot
11.10.3. Products
11.10.4. Recent Developments
11.11. Nutreco N.V.
11.11.1. Company Overview
11.11.2. Financial Snapshot
11.11.3. Products
11.11.4. Recent Developments
11.12. InVivo Agrosciences
11.12.1. Company Overview
11.12.2. Financial Snapshot
11.12.3. Products
11.12.4. Recent Developments Prolgae
11.13. Farbest-Tallman Foods Corporation
11.13.1. Company Overview
11.13.2. Financial Snapshot
11.13.3. Products
11.13.4. Recent Developments
11.14. Jubilant Life Sciences Ltd
11.14.1. Company Overview
11.14.2. Financial Snapshot
11.14.3. Products
11.14.4. Recent Developments
LIST OF TABLES
Table 1 Nutritional Premixes Market Size, By Type
Table 2 Nutritional Premixes Market Size, By Form (US$ Mn, CAGR %), 2019-2025
Table 3 Nutritional Premixes Market, By Application, (US$ Mn, CAGR %), 2019-2025
Table 4 Nutritional Premixes Market, By Region, (US$ Mn, CAGR %), 2019-2025
Table 5 North America: Nutritional Premixes Market Size, By Country, (US$ Mn, CAGR %), 2019-2025
Table 6 North America: Nutritional Premixes Market Size, By Type (US$ Mn, CAGR %), 2019-2025
Table 7 North America: Nutritional Premixes Market Size, By Form (US$ Mn, CAGR %), 2019-2025
Table 8 North America: Nutritional Premixes Market Size, Application (US$ Mn, CAGR %), 2019-2025
Table 9 US: Nutritional Premixes Market Size, By Type (US$ Mn, CAGR %), 2019-2025
Table 10 US: Nutritional Premixes Market Size, By Form (US$ Mn, CAGR %), 2019-2025
Table 11 US: Nutritional Premixes Market Size, By Application (US$ Mn, CAGR %), 2019-2025
Table 12 Canada: Nutritional Premixes Market Size, By Type (US$ Mn, CAGR %), 2019-2025
Table 13 Canada: Nutritional Premixes Market Size, By Form (US$ Mn, CAGR %), 2019-2025
Table 14 Canada: Nutritional Premixes Market Size, By Application (US$ Mn, CAGR %), 2019-2025
Table 15 Europe: Nutritional Premixes Market Size, By Country (US$ Mn, CAGR %), 2019-2025
Table 16 Europe: Nutritional Premixes Market Size, By Type (US$ Mn, CAGR %), 2019-2025
Table 17 Europe: Nutritional Premixes Market Size, By Form (US$ Mn, CAGR %), 2019-2025
Table 18 Europe: Nutritional Premixes Market Size, By Application (US$ Mn, CAGR %), 2019-2025
Table 19 Germany: Nutritional Premixes Market Size, By Type, (US$ Mn, CAGR %), 2019-2025
Table 20 Germany: Nutritional Premixes Market Size, By Form (US$ Mn, CAGR %), 2019-2025
Table 21 Germany: Nutritional Premixes Market Size, By Application (US$ Mn, CAGR %), 2019-2025
Table 22 France: Nutritional Premixes Market Size, By Type, (US$ Mn, CAGR %), 2019-2025
Table 23 France: Nutritional Premixes Market Size, By Form (US$ Mn, CAGR %), 2019-2025
Table 24 France: Nutritional Premixes Market Size, By Application (US$ Mn, CAGR %), 2019-2025
Table 25 UK: Nutritional Premixes Market Size, By Type, (US$ Mn, CAGR %), 2019-2025
Table 26 UK: Nutritional Premixes Market Size, By Form (US$ Mn, CAGR %), 2019-2025
Table 27 UK: Nutritional Premixes Market Size, By Application (US$ Mn, CAGR %), 2019-2025
Table 28 Italy: Nutritional Premixes Market Size, By Type, (US$ Mn, CAGR %), 2019-2025
Table 29 Italy: Nutritional Premixes Market Size, By Form (US$ Mn, CAGR %), 2019-2025
Table 30 Italy: Nutritional Premixes Market Size, By Application (US$ Mn, CAGR %), 2019-2025
Table 31 Spain: Nutritional Premixes Market Size, By Type, (US$ Mn, CAGR %), 2019-2025
Table 32 Spain: Nutritional Premixes Market Size, By Form (US$ Mn, CAGR %), 2019-2025
Table 33 Spain: Nutritional Premixes Market Size, By Application (US$ Mn, CAGR %), 2019-2025
Table 34 Rest of Europe: Nutritional Premixes Market Size, By Type, (US$ Mn, CAGR %), 2019-2025
Table 35 Rest of Europe: Nutritional Premixes Market Size, By Form (US$ Mn, CAGR %), 2019-2025
Table 36 Rest of Europe: Nutritional Premixes Market Size, By Application (US$ Mn, CAGR %), 2019-2025
Table 37 Asia-Pacific: Nutritional Premixes Market Size, By Country, 2019-2025 (Kiloton)
Table 38 Asia-Pacific: Nutritional Premixes Market Size, By Type, (US$ Mn, CAGR %), 2019-2025
Table 39 Asia-Pacific: Nutritional Premixes Market Size, By Form (US$ Mn, CAGR %), 2019-2025
Table 40 Asia-Pacific: Nutritional Premixes Market Size, By Application (US$ Mn, CAGR %), 2019-2025
Table 41 China: Nutritional Premixes Market Size, By Type, (US$ Mn, CAGR %), 2019-2025
Table 42 China: Nutritional Premixes Market Size, By Form (US$ Mn, CAGR %), 2019-2025
Table 43 China: Nutritional Premixes Market Size, By Application (US$ Mn, CAGR %), 2019-2025
Table 44 Japan: Nutritional Premixes Market Size, By Type, (US$ Mn, CAGR %), 2019-2025
Table 45 Japan: Nutritional Premixes Market Size, By Form (US$ Mn, CAGR %), 2019-2025
Table 46 Japan: Nutritional Premixes Market Size, By Application (US$ Mn, CAGR %), 2019-2025
Table 47 India: Nutritional Premixes Market Size, By Type, (US$ Mn, CAGR %), 2019-2025
Table 48 India: Nutritional Premixes Market Size, By Form (US$ Mn, CAGR %), 2019-2025
Table 49 India: Nutritional Premixes Market Size, By Application (US$ Mn, CAGR %), 2019-2025
Table 50 Rest of APAC: Nutritional Premixes Market Size, By Type, (US$ Mn, CAGR %), 2019-2025
Table 51 Rest of APAC: Nutritional Premixes Market Size, By Form (US$ Mn, CAGR %), 2019-2025
Table 52 Rest of APAC: Nutritional Premixes Market Size, By Application (US$ Mn, CAGR %), 2019-2025
Table 53 Latin America: Nutritional Premixes Market Size, By Type, (US$ Mn, CAGR %), 2019-2025
Table 54 Latin America: Nutritional Premixes Market Size, By Form (US$ Mn, CAGR %), 2019-2025
Table 55 Latin America: Nutritional Premixes Market Size, By Application (US$ Mn, CAGR %), 2019-2025
Table 56 Middle East and Africa: Nutritional Premixes Market Size, By Type, (US$ Mn, CAGR %), 2019-2025
Table 57 Middle East and Africa: Nutritional Premixes Market Size, By Form (US$ Mn, CAGR %), 2019-2025
Table 58 Middle East and Africa: Nutritional Premixes Market Size, By Application (US$ Mn, CAGR %), 2019-2025
LIST OF FIGURES
Figure 1 Nutritional Premixes Market Segmentation
Figure 2 Nutritional Premixes Market: Research Design
Figure 3 Drivers, Restraints, and Opportunities in the Nutritional Premixes Market
Figure 4 Nutritional Premixes Market: Porter’s Five Forces Analysis
Figure 5 Nutritional Premixes Market: Value Chain Analysis
Figure 6 Nutritional Premixes Market: Pricing Analysis
Figure 7 Nutritional Premixes Market: Market Share Analysis
Figure 8 Nutritional Premixes Market, By Type (2019-2025)
Figure 9 Nutritional Premixes Market, By Form (2019-2025)
Figure 10 Nutritional Premixes Market, By Application (2019-2025)
Figure 11 Global Nutritional Premixes Market, By Region
Figure 12 North America: Nutritional Premixes Market Snapshot
Figure 13 Europe: Nutritional Premixes Market Snapshot
Figure 14 Asia-Pacific: Nutritional Premixes Market Snapshot
Figure 15 Latin America: Nutritional Premixes Market Snapshot
Figure 16 Middle East and Africa: Nutritional Premixes Market Snapshot
Figure 17 Koninklijke DSM N.V.: Financial Snapshot
Figure 18 Steggall Nutrition: Financial Snapshot
Figure 19 Glanbia Plc.: Financial Snapshot
Figure 20 BASF SE: Financial Snapshot
Figure 21 Corbion N.V.: Nutritional Premixes Market Snapshot
Figure 22 Watson Foods Co., Inc.: Financial Snapshot
Figure 23 Archer Daniels Midland Company: Financial Snapshot
Figure 24 Cargill, Incorporated: Financial Snapshot
Figure 25 SternVitamin GmbH & Co. KG: Financial Snapshot
Figure 26 Vitablend Nederland B.V.: Nutritional Premixes Market Snapshot
Figure 27 Hellay Australia Pty. Ltd.: Financial Snapshot
Figure 28 Nutreco N.V.: Financial Snapshot
Figure 29 InVivo Agrosciences: Financial Snapshot
Figure 30 Farbest-Tallman Foods Corporation: Financial Snapshot
Figure 31 Jubilant Life Sciences Ltd: Financial Snapshot
Let us know more about your research need and we will customize an offer exclusively for you!
Let us know more about your research need and we will customize an offer exclusively for you!
Testimonial
© 2019 Data N Analysis. All Rights Reserved | Design by Data N Analysis