Global Dairy Products Market Size and Overview
Dairy products Market Outlook
With increasing world-population and welfare, the demand for the nutritional food is rising sharply. The high nutrition trend is gaining traction and will continue to evoke interest in the upcoming years. The consumers have become more aware about protein and other nutrient benefits in supporting active lifestyle. Milk and milk products could be a great solution for this due to their capability to satisfy the food need with the high nutrition for human consumption. In addition, most of the nutrients present in milk are in the forms that are easily absorbed by the human body. Milk production will continue to rise, and milk products structure will be more diversified in upcoming years. With the improvement of people’s living standards, the consumption of dairy products will increase. The global dairy products market size was $408.6 billion in 2018, and is projected to reach $658.7 million by 2025, growing at a CAGR of 5.9% from 2019 to 2025.
Dairy products Market Snapshot
Dairy Products Market
Market Dynamics
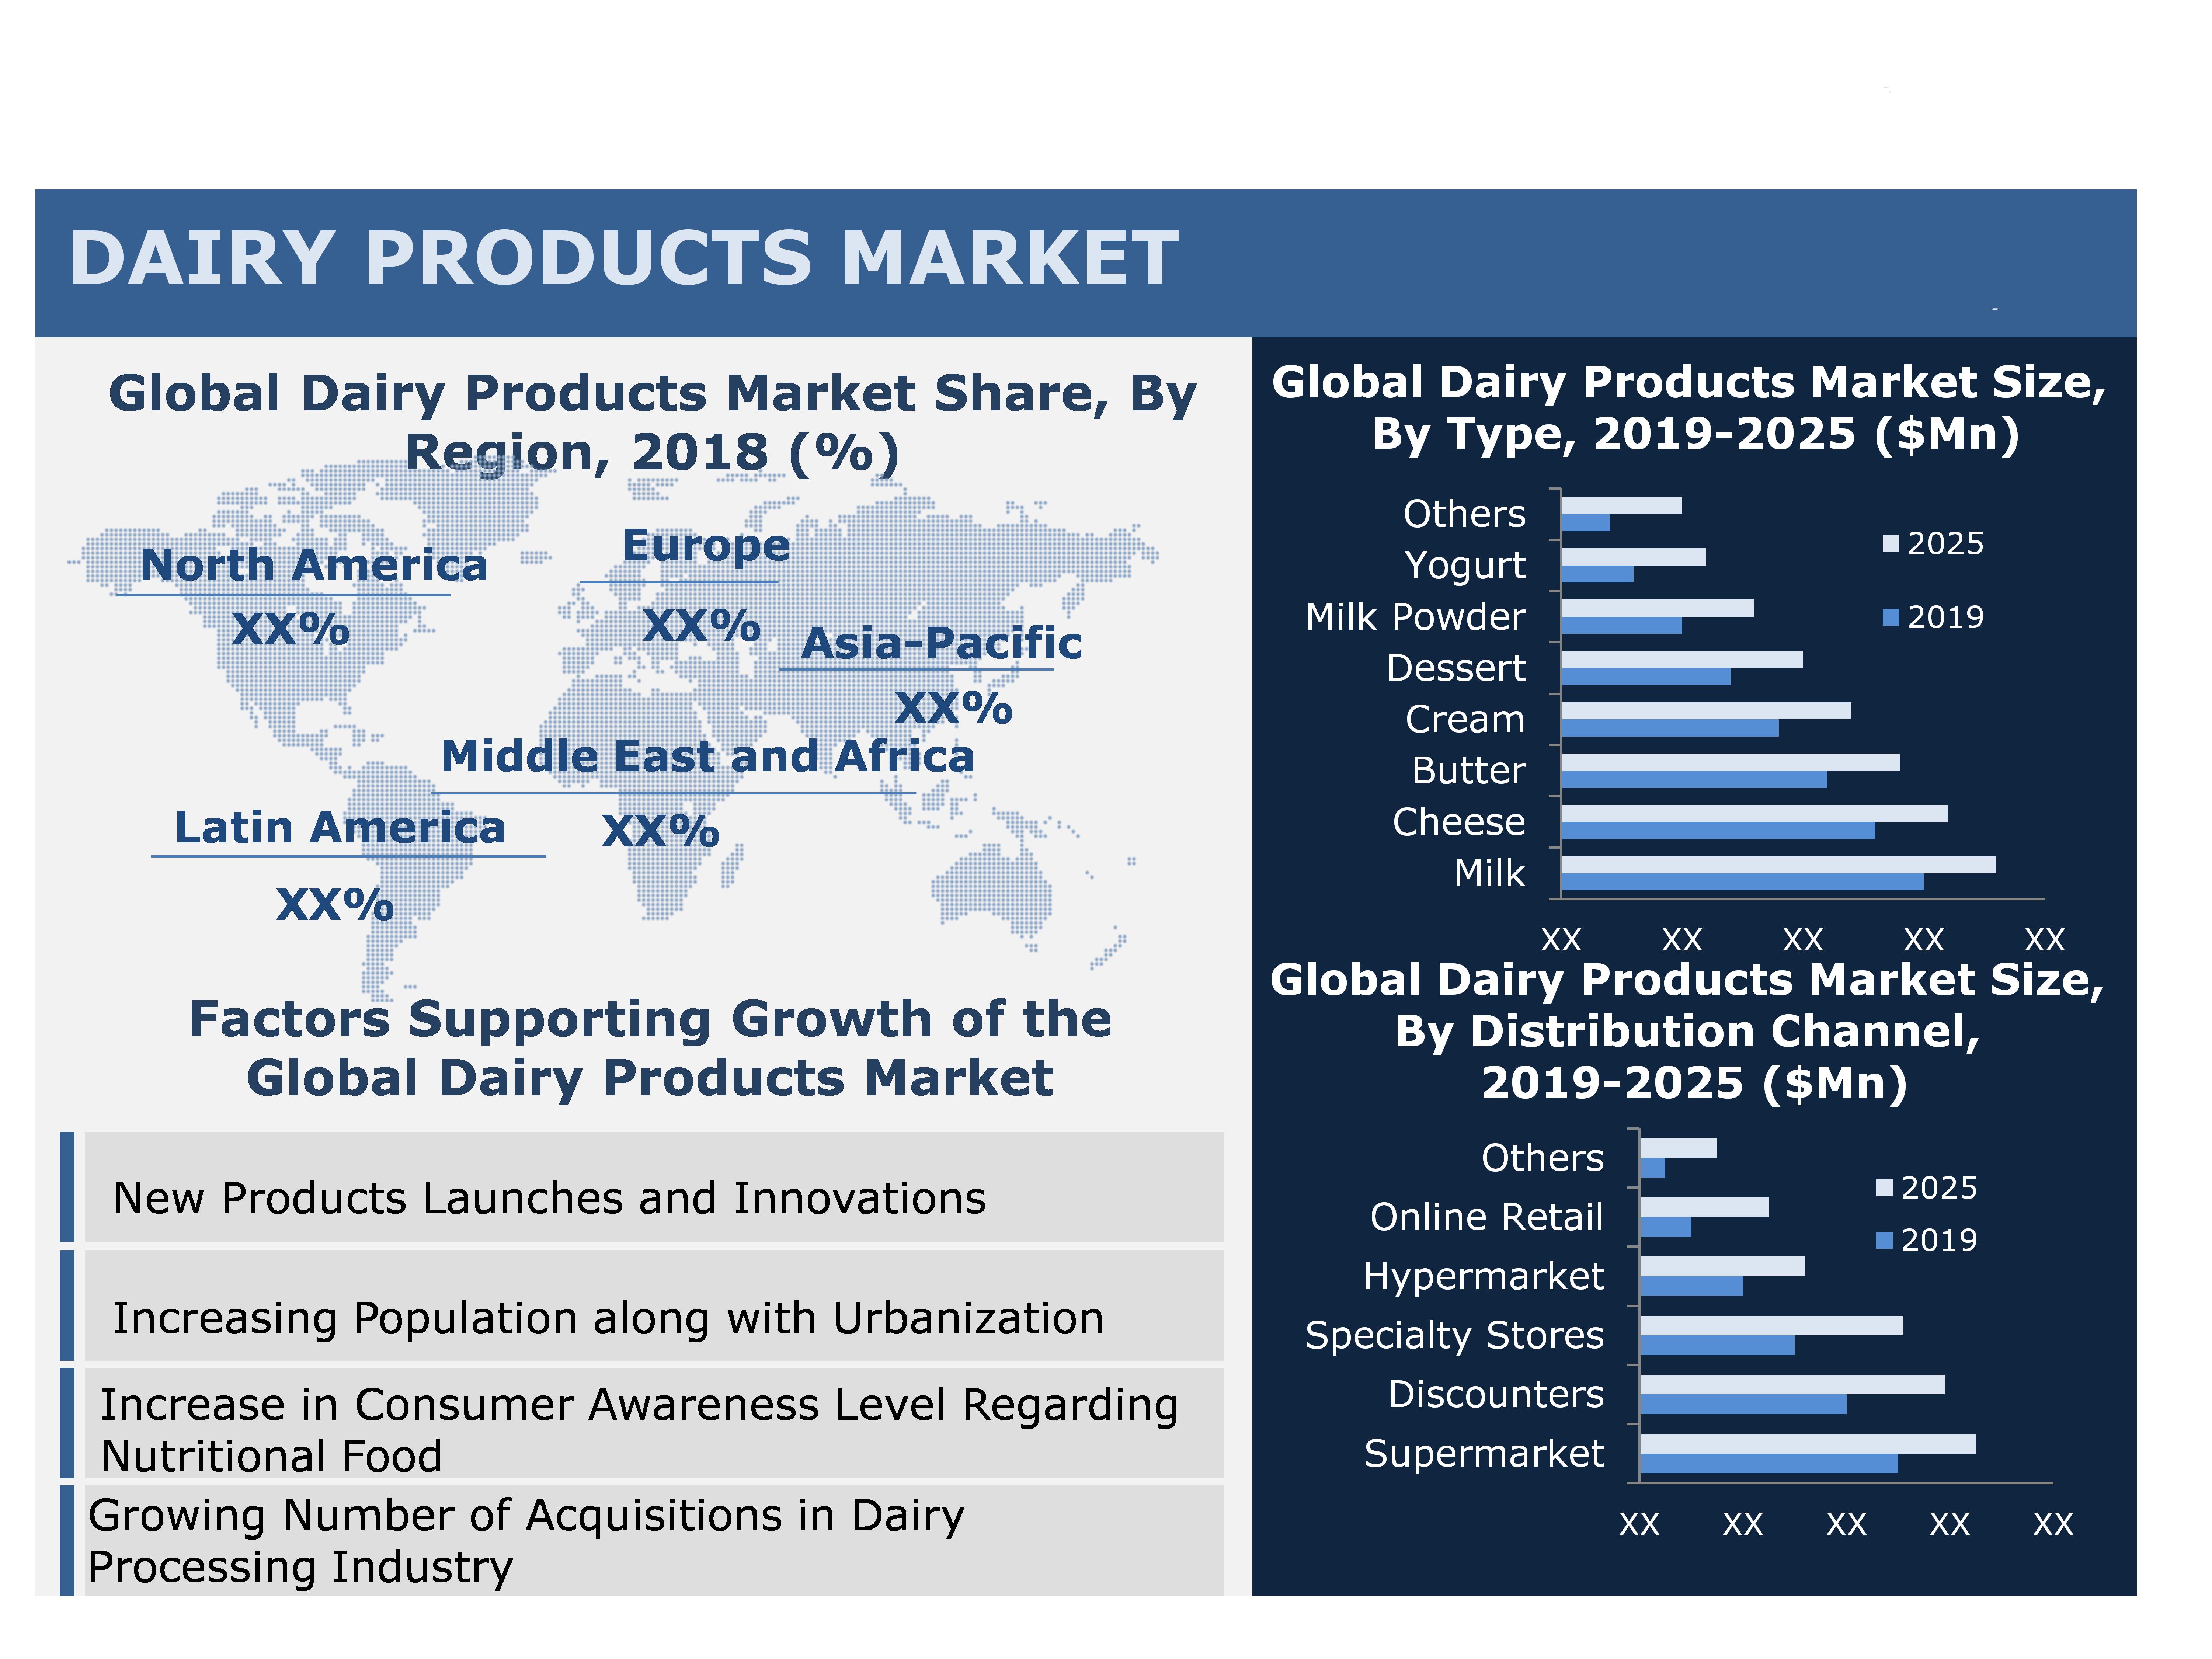
New products launches and innovations, increasing population along with urbanization, increase in consumer awareness level regarding nutritional food, and growing number of acquisitions in dairy processing industry have fueled the growth of the global dairy products market. Conversely, milk allergy and lactose intolerance has hindered the growth of this market to some extent.
Segment Overview:
Type Segment Overview
On the basis of type, food & beverages segment accounted for the major share of the global dairy products market in 2018. The large share of this segment mainly attributed to its increased production as well as consumption across the globe and significant improvements in all the unit operations of the milk processing. However, cheese is expected to grow at the highest CAGR during the forecast period.
Distribution Channel Overview
On the basis of distribution channel, supermarket held the largest share of the global dairy products market in 2018. The large share of this segment is mainly attributed to its advantages over other distribution channels, such as one-stop shopping for consumers; a comfortable and environment; and much wider selection of household items along with dairy products.
Geographic Overview
On the basis of geography, the dairy products market analysis is conducted across North America, Europe, Asia-Pacific, Latin America, and Middle East and Africa. Europe held the major share in global dairy products market in 2018, and is expected to remain dominant throughout the forecast period. The huge share of this market is attributed to huge technological advancement in milk processing; increased sales of yogurt, cheese, sour milk, etc.; and rising number of convenience stores and supermarkets. However, Asia-Pacific is expected to grow at the fastest CAGR during the forecast period. The fastest growth of this region primarily attributed to huge milk production and promotion by the government and dairy industry for the milk processing, rising population; increasing consumer disposable income; and growing foreign investment.
Competitive Landscape
The global dairy products market is a moderately competitive market. To enlargement of market presence key market players’ mainly focus on strategies such as new product launches, mergers, acquisitions, and collaborations. Key players include in dairy products market are Dean Foods Company, Saputo Inc., Inner Mongolia Yili Industrial Group Co Ltd, Fonterra Co-operative Group Limited, Royal Friesland Campina N.V., Kraft Heinz Company, Nestle S.A., Danone S.A., Arla Foods amba, Megmilk Snow Brand Co., Ltd. Unilever N.V., Parmalat S.p.A., China Mengniu Dairy Co., Ltd., SODIAAL, and Dairy Farmers of America Inc.
Dairy products Market Segments:
Dairy products Market by Type
Milk
Cheese
Butter
Cream
Dessert
Milk Powder
Yogurt
Others
Dairy products Market by Distribution Channel
Supermarket
Discounters
Specialty Stores
Hypermarket
Online Retail
Others
Dairy products Market by Geography
North America
U.S.
Canada
Germany
France
U.K.
Italy
Spain
Rest of Europe
Asia-Pacific
China
Japan
India
Rest of Asia Pacific
Latin America
Middle East & Africa
TABLE OF CONTENT
1. Introduction
1.1. Market Definition
1.2. Purpose of the Report
1.3. Currency
1.4. Limitations
1.5. Stakeholders
2. Research Methodology
2.1. Research Scope
2.2. Market Segmentation
2.3. Research Approach
2.3.1. Top-Down Approach
2.3.2. Bottom-Up Approach
2.4. Primary Research
2.5. Secondary Research
2.6. Assumptions
3. Executive Summary
3.1. Global Market Snapshot, by Geography
3.2. Dairy Products Market, by Type
3.3. Dairy Products Market, by Distribution Channel
3.4. Competitive Landscape
4. Market Overview
4.1. Market Dynamics
4.1.1. Driving Forces
4.1.1.1. New Products and Innovations
4.1.1.2. Increasing Population along with Urbanization
4.1.1.3. Increase in Consumer Awareness Level Regarding Nutritional Food
4.1.1.4. Growing Number of Acquisitions in Dairy Processing Industry
4.1.2. Restraining Factors
4.1.2.1. Milk Allergy And Lactose Intolerance
4.1.3. Opportunity Matrix
4.1.3.1. Technological Advancement in Dairy Processing Sector
4.1.3.2. Developing Economies
5. Industry Insights
5.1. Porter's Five Forces Analysis
5.1.1. Bargaining power of supplier
5.1.2. Bargaining power of buyer
5.1.3. Threat of substitute
5.1.4. Threat of new entrant
5.1.5. Degree of competition
5.2. Value Chain Analysis
5.3. Pricing Analysis
5.4. Market Share Analysis
6. Dairy Products Market, by Type
6.1. Milk
6.2. Cheese
6.3. Butter
6.4. Cream
6.5. Dessert
6.6. Milk Powder
6.7. Yogurt
6.8. Others
7. Dairy Products Market, by Distribution Channel
7.1. Supermarket
7.2. Discounters
7.3. Specialty Stores
7.4. Hypermarket
7.5. Online Retail
7.6. Others
8. Dairy Products Market, by Region
8.1. North America
8.1.1. U.S.
8.1.2. Canada
8.2. Europe
8.2.1. Germany
8.2.2. France
8.2.3. UK
8.2.4. Italy
8.2.5. Spain
8.2.6. Rest of Europe
8.3. Asia-Pacific
8.3.1. China
8.3.2. Japan
8.3.3. India
8.3.4. Rest of APAC
8.4. Latin America
8.5. Middle East and Africa
9. Competitive Landscape
9.1. Key Players Analysis
9.2. Strategic Analysis
9.2.1. New Product Developments
9.2.2. Mergers & Acquisitions
9.2.3. Portfolio/Production Capacity Expansions
9.2.4. Geographic Expansions
9.2.5. Joint Ventures, Collaborations, Partnerships & Agreements
9.2.6. Others
10. Company Profiles
10.1. Dean Foods Company
10.1.1. Company Overview
10.1.2. Financial Snapshot
10.1.3. Products
10.1.4. Recent Developments
10.2. Saputo Inc.
10.2.1. Company Overview
10.2.2. Financial Snapshot
10.2.3. Products
10.2.4. Recent Developments
10.3. Inner Mongolia Yili Industrial Group Co Ltd.
10.3.1. Company Overview
10.3.2. Financial Snapshot
10.3.3. Products
10.3.4. Recent Developments
10.4. Fonterra Co-operative Group Limited
10.4.1. Company Overview
10.4.2. Financial Snapshot
10.4.3. Products
10.4.4. Recent Developments
10.5. Royal Friesland Campina N.V.
10.5.1. Company Overview
10.5.2. Financial Snapshot
10.5.3. Products
10.5.4. Recent Developments
10.6. Kraft Heinz Company
10.6.1. Company Overview
10.6.2. Financial Snapshot
10.6.3. Products
10.6.4. Recent Developments
10.7. Nestle S.A.
10.7.1. Company Overview
10.7.2. Financial Snapshot
10.7.3. Products
10.7.4. Recent Developments
10.8. Danone S.A.
10.8.1. Company Overview
10.8.2. Financial Snapshot
10.8.3. Products
10.8.4. Recent Developments
10.9. Arla Foods amba.
10.9.1. Company Overview
10.9.2. Financial Snapshot
10.9.3. Products
10.9.4. Recent Developments
10.10. Megmilk Snow Brand Co., Ltd
10.10.1. Company Overview
10.10.2. Financial Snapshot
10.10.3. Products
10.10.4. Recent Developments
10.11. Unilever N.V.
10.11.1. Company Overview
10.11.2. Financial Snapshot
10.11.3. Products
10.11.4. Recent Developments
10.12. Parmalat S.p.A.
10.12.1. Company Overview
10.12.2. Financial Snapshot
10.12.3. Products
10.12.4. Recent Developments
10.13. China Mengniu Dairy Co., Ltd.
10.13.1. Company Overview
10.13.2. Financial Snapshot
10.13.3. Products
10.13.4. Recent Developments
10.14. SODIAAL
10.14.1. Company Overview
10.14.2. Financial Snapshot
10.14.3. Products
10.14.4. Recent Developments
10.15. Dairy Farmers of America Inc.
10.15.1. Company Overview
10.15.2. Financial Snapshot
10.15.3. Products
10.15.4. Recent Developments
LIST OF TABLES
Table 1 Dairy Products Market Size, By Type
Table 2 Dairy Products Market Size, By Distribution Channel (US$ Mn, CAGR %), 2019-2025
Table 3 Dairy Products Market, By Region, (US$ Mn, CAGR %), 2019-2025
Table 4 North America: Dairy Products Market Size, By Country, (US$ Mn, CAGR %), 2019-2025
Table 5 North America: Dairy Products Market Size, By Type (US$ Mn, CAGR %), 2019-2025
Table 6 North America: Dairy Products Market Size, By Distribution Channel (US$ Mn, CAGR %), 2019-2025
Table 7 US: Dairy Products Market Size, By Type (US$ Mn, CAGR %), 2019-2025
Table 8 US: Dairy Products Market Size, By Distribution Channel (US$ Mn, CAGR %), 2019-2025
Table 9 Canada: Dairy Products Market Size, By Type (US$ Mn, CAGR %), 2019-2025
Table 10 Canada: Dairy Products Market Size, By Distribution Channel (US$ Mn, CAGR %), 2019-2025
Table 11 Europe: Dairy Products Market Size, By Country (US$ Mn, CAGR %), 2019-2025
Table 12 Europe: Dairy Products Market Size, By Type (US$ Mn, CAGR %), 2019-2025
Table 13 Europe: Dairy Products Market Size, By Distribution Channel (US$ Mn, CAGR %), 2019-2025
Table 14 Germany: Dairy Products Market Size, By Type, (US$ Mn, CAGR %), 2019-2025
Table 15 Germany: Dairy Products Market Size, By Distribution Channel (US$ Mn, CAGR %), 2019-2025
Table 16 France: Dairy Products Market Size, By Type, (US$ Mn, CAGR %), 2019-2025
Table 17 France: Dairy Products Market Size, By Distribution Channel (US$ Mn, CAGR %), 2019-2025
Table 18 UK: Dairy Products Market Size, By Type, (US$ Mn, CAGR %), 2019-2025
Table 19 UK: Dairy Products Market Size, By Distribution Channel (US$ Mn, CAGR %), 2019-2025
Table 20 Italy: Dairy Products Market Size, By Type, (US$ Mn, CAGR %), 2019-2025
Table 21 Italy: Dairy Products Market Size, By Distribution Channel (US$ Mn, CAGR %), 2019-2025
Table 22 Spain: Dairy Products Market Size, By Type, (US$ Mn, CAGR %), 2019-2025
Table 23 Spain: Dairy Products Market Size, By Distribution Channel (US$ Mn, CAGR %), 2019-2025
Table 24 Rest of Europe: Dairy Products Market Size, By Type, (US$ Mn, CAGR %), 2019-2025
Table 25 Rest of Europe: Dairy Products Market Size, By Distribution Channel (US$ Mn, CAGR %), 2019-2025
Table 26 Asia-Pacific: Dairy Products Market Size, By Country, 2019-2025 (Kiloton)
Table 27 Asia-Pacific: Dairy Products Market Size, By Type, (US$ Mn, CAGR %), 2019-2025
Table 28 Asia-Pacific: Dairy Products Market Size, By Distribution Channel (US$ Mn, CAGR %), 2019-2025
Table 29 China: Dairy Products Market Size, By Type, (US$ Mn, CAGR %), 2019-2025
Table 30 China: Dairy Products Market Size, By Distribution Channel (US$ Mn, CAGR %), 2019-2025
Table 31 Japan: Dairy Products Market Size, By Type, (US$ Mn, CAGR %), 2019-2025
Table 32 Japan: Dairy Products Market Size, By Distribution Channel (US$ Mn, CAGR %), 2019-2025
Table 33 India: Dairy Products Market Size, By Type, (US$ Mn, CAGR %), 2019-2025
Table 34 India: Dairy Products Market Size, By Distribution Channel (US$ Mn, CAGR %), 2019-2025
Table 35 Rest of APAC: Dairy Products Market Size, By Type, (US$ Mn, CAGR %), 2019-2025
Table 51 Rest of APAC: Dairy Products Market Size, By Distribution Channel (US$ Mn, CAGR %), 2019-2025
Table 36 Latin America: Dairy Products Market Size, By Type, (US$ Mn, CAGR %), 2019-2025
Table 37 Latin America: Dairy Products Market Size, By Distribution Channel (US$ Mn, CAGR %), 2019-2025
Table 38 Middle East and Africa: Dairy Products Market Size, By Type, (US$ Mn, CAGR %), 2019-2025
Table 39 Middle East and Africa: Dairy Products Market Size, By Distribution Channel (US$ Mn, CAGR %), 2019-2025
LIST OF FIGURES
Figure 1 Dairy Products Market Segmentation
Figure 2 Dairy Products Market: Research Design
Figure 3 Drivers, Restraints, and Opportunities in the Dairy Products Market
Figure 4 Dairy Products Market: Porter’s Five Forces Analysis
Figure 5 Dairy Products Market: Value Chain Analysis
Figure 6 Dairy Products Market: Market Share Analysis
Figure 7 Dairy Products Market: Pricing Analysis
Figure 8 Dairy Products Market, By Type (2019-2025)
Figure 9 Dairy Products Market, By Distribution Channel (2019-2025)
Figure 10 Global Dairy Products Market, By Region
Figure 11 North America: Dairy Products Market Snapshot
Figure 12 Europe: Dairy Products Market Snapshot
Figure 13 Asia-Pacific: Dairy Products Market Snapshot
Figure 14 Latin America: Dairy Products Market Snapshot
Figure 15 Middle East and Africa: Dairy Products Market Snapshot
Figure 16 Dean Foods Company: Financial Snapshot
Figure 17 Saputo Inc.: Financial Snapshot
Figure 18 Inner Mongolia Yili Industrial Group Co Ltd: Financial Snapshot
Figure 19 Fonterra Co-operative Group Limited: Financial Snapshot
Figure 20 Royal Friesland Campina N.V.: Financial Snapshot
Figure 21 Kraft Heinz Company: Financial Snapshot
Figure 22 Nestle S.A.: Financial Snapshot
Figure 23 Danone S.A.: Financial Snapshot
Figure 24 Arla Foods amba: Financial Snapshot
Figure 25 Megmilk Snow Brand Co., Ltd.: Financial Snapshot
Figure 26 Unilever N.V., Parmalat S.P.A.: Financial Snapshot
Figure 27 China Mengniu Dairy Co., Ltd.: Financial Snapshot
Figure 28 SODIAAL: Financial Snapshot
Figure 29 Dairy Farmers of America Inc: Financial Snapshot
Let us know more about your research need and we will customize an offer exclusively for you!
Let us know more about your research need and we will customize an offer exclusively for you!
Testimonial
© 2019 Data N Analysis. All Rights Reserved | Design by Data N Analysis